paperplot
Publication-correct matplotlib figures, journal by journal.
Most matplotlib styling focuses on the look. paperplot does that too — but it
also handles the parts that decide whether a journal accepts your figure:
- sizes it to the journal's real column width (8.6 cm, 17.8 cm, …), not a generic default;
- embeds fonts correctly (Type-42, no Type-3);
- preflights it for the rules figures actually get rejected over — font type, line weight, lettering height, and grayscale legibility;
- shows it on the page before you submit —
preview_in_page()drops the figure into a true-to-scale mock journal page with real body text, so you see exactly how big it lands and whether the lettering holds up. A paperplot original — most styling packages stop at the figure. See the Gallery.
Ships Physical Review (APS) (incl. PRL/PRX/PRB), Nature, and IEEE, plus a presentation target for slides.
The two-call pattern
import numpy as np
import paperplot as pp

pp.use("aps")                          # or "nature" / "ieee" / "prl" / "talk"
fig, ax = pp.figure(width="single")    # 8.6 cm wide, golden ratio, styled
ax.plot(np.linspace(0, 10, 200), np.sin(np.linspace(0, 10, 200)))
ax.set_xlabel(r"delay $\tau$ (ns)")
pp.save(fig, "fig1.pdf")               # embeds fonts, runs preflight()
See the Gallery for what comes out, and the README for the full feature tour.
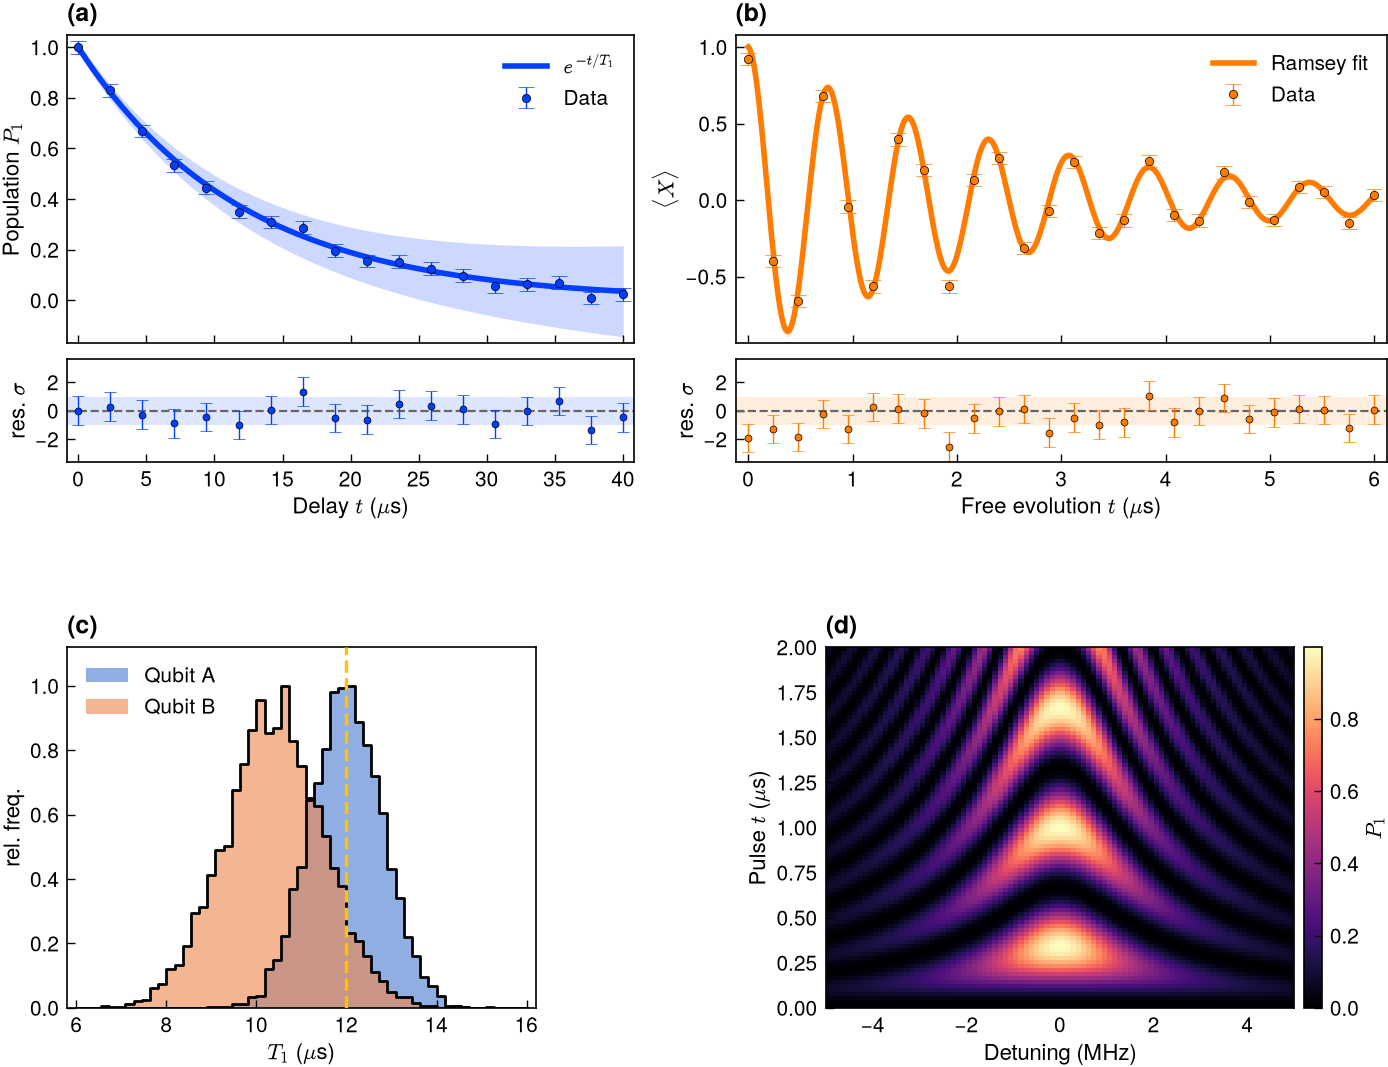
One figure, many panels
Real papers stack panels. A custom GridSpec gives two fit panels (a, b),
each with a flush residual strip sharing its x-axis, plus a distribution (c)
and a 2-D map (d) — one figure, four panel letters, all journal-styled. See the
Composite layout in the gallery, or the code in
the Showcase.
See it on the page
The part most styling packages skip: preview_in_page() drops your figure into a
true-to-scale mock journal page with real body text — so you see exactly how big it
lands and whether the lettering holds up, before you submit.
-
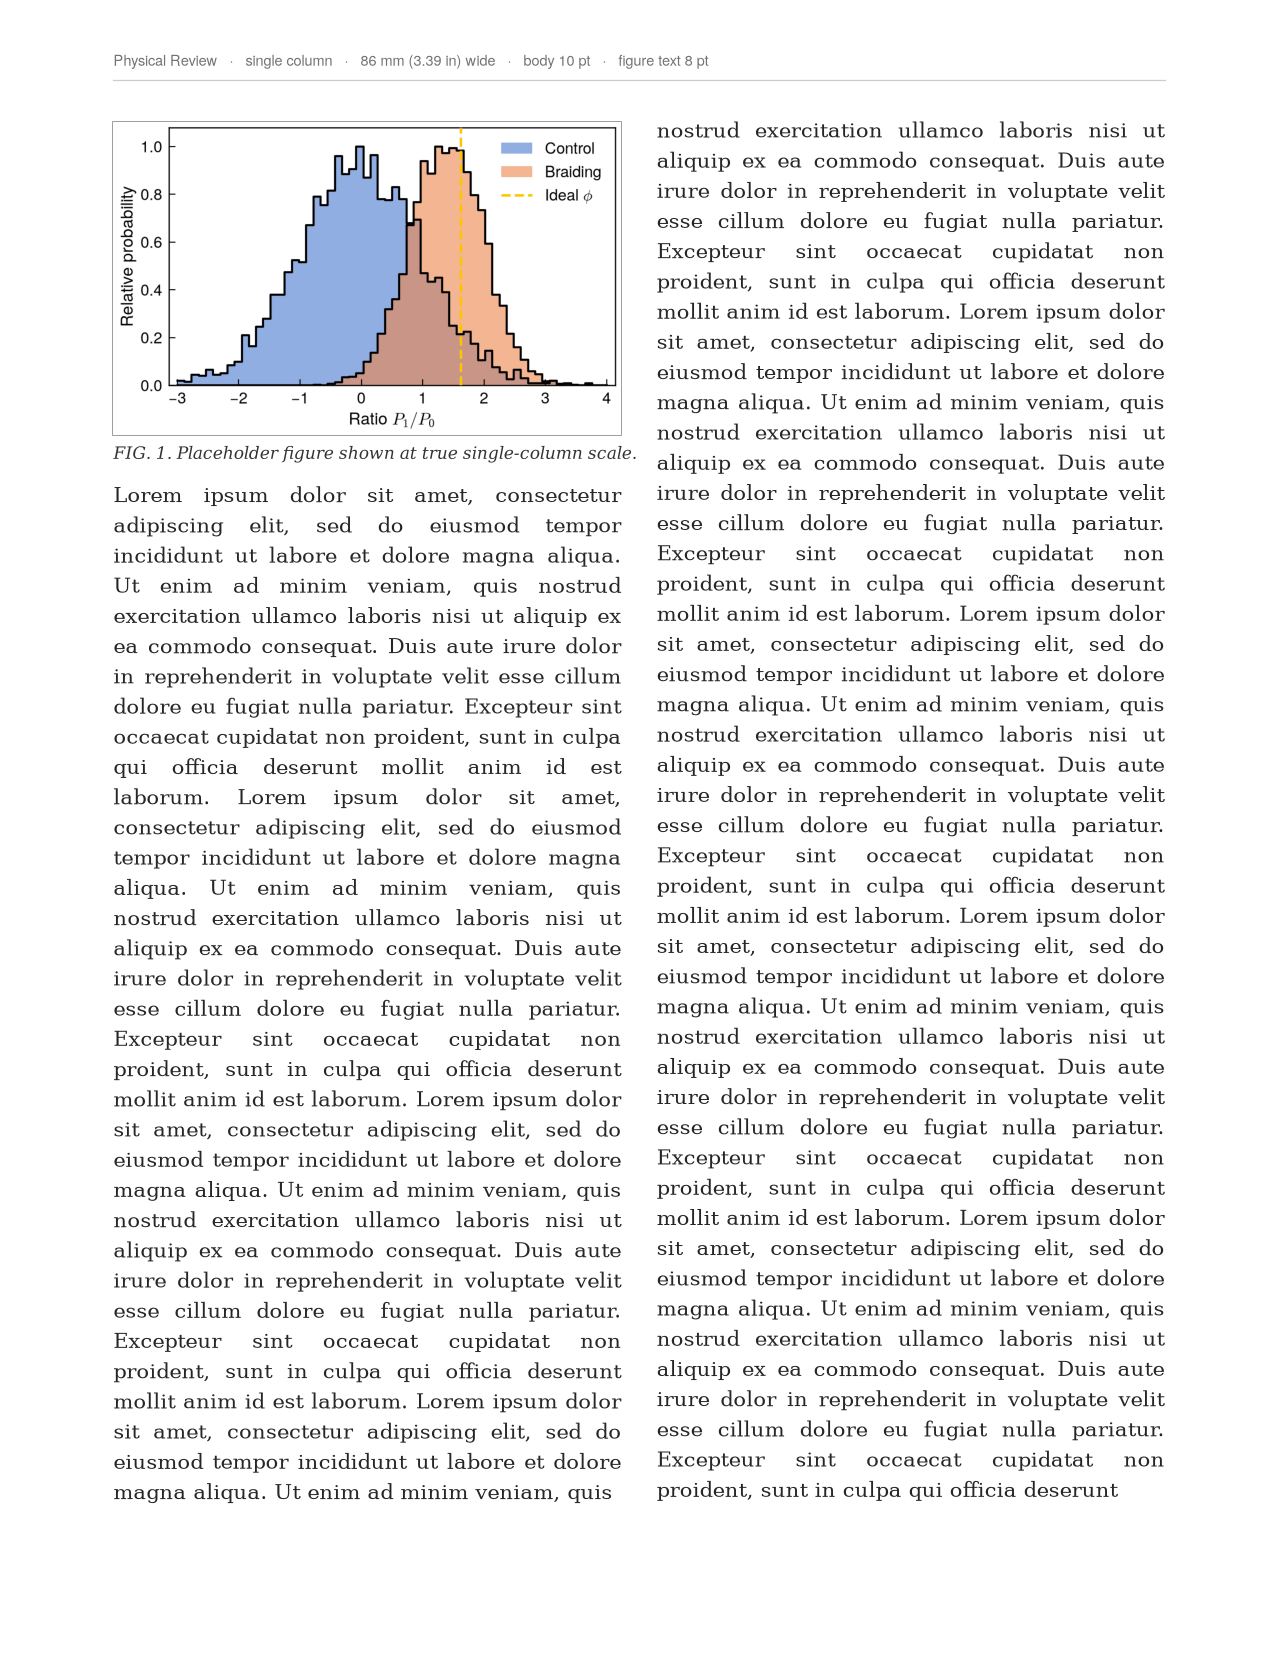
Overlapping histograms — in page
-
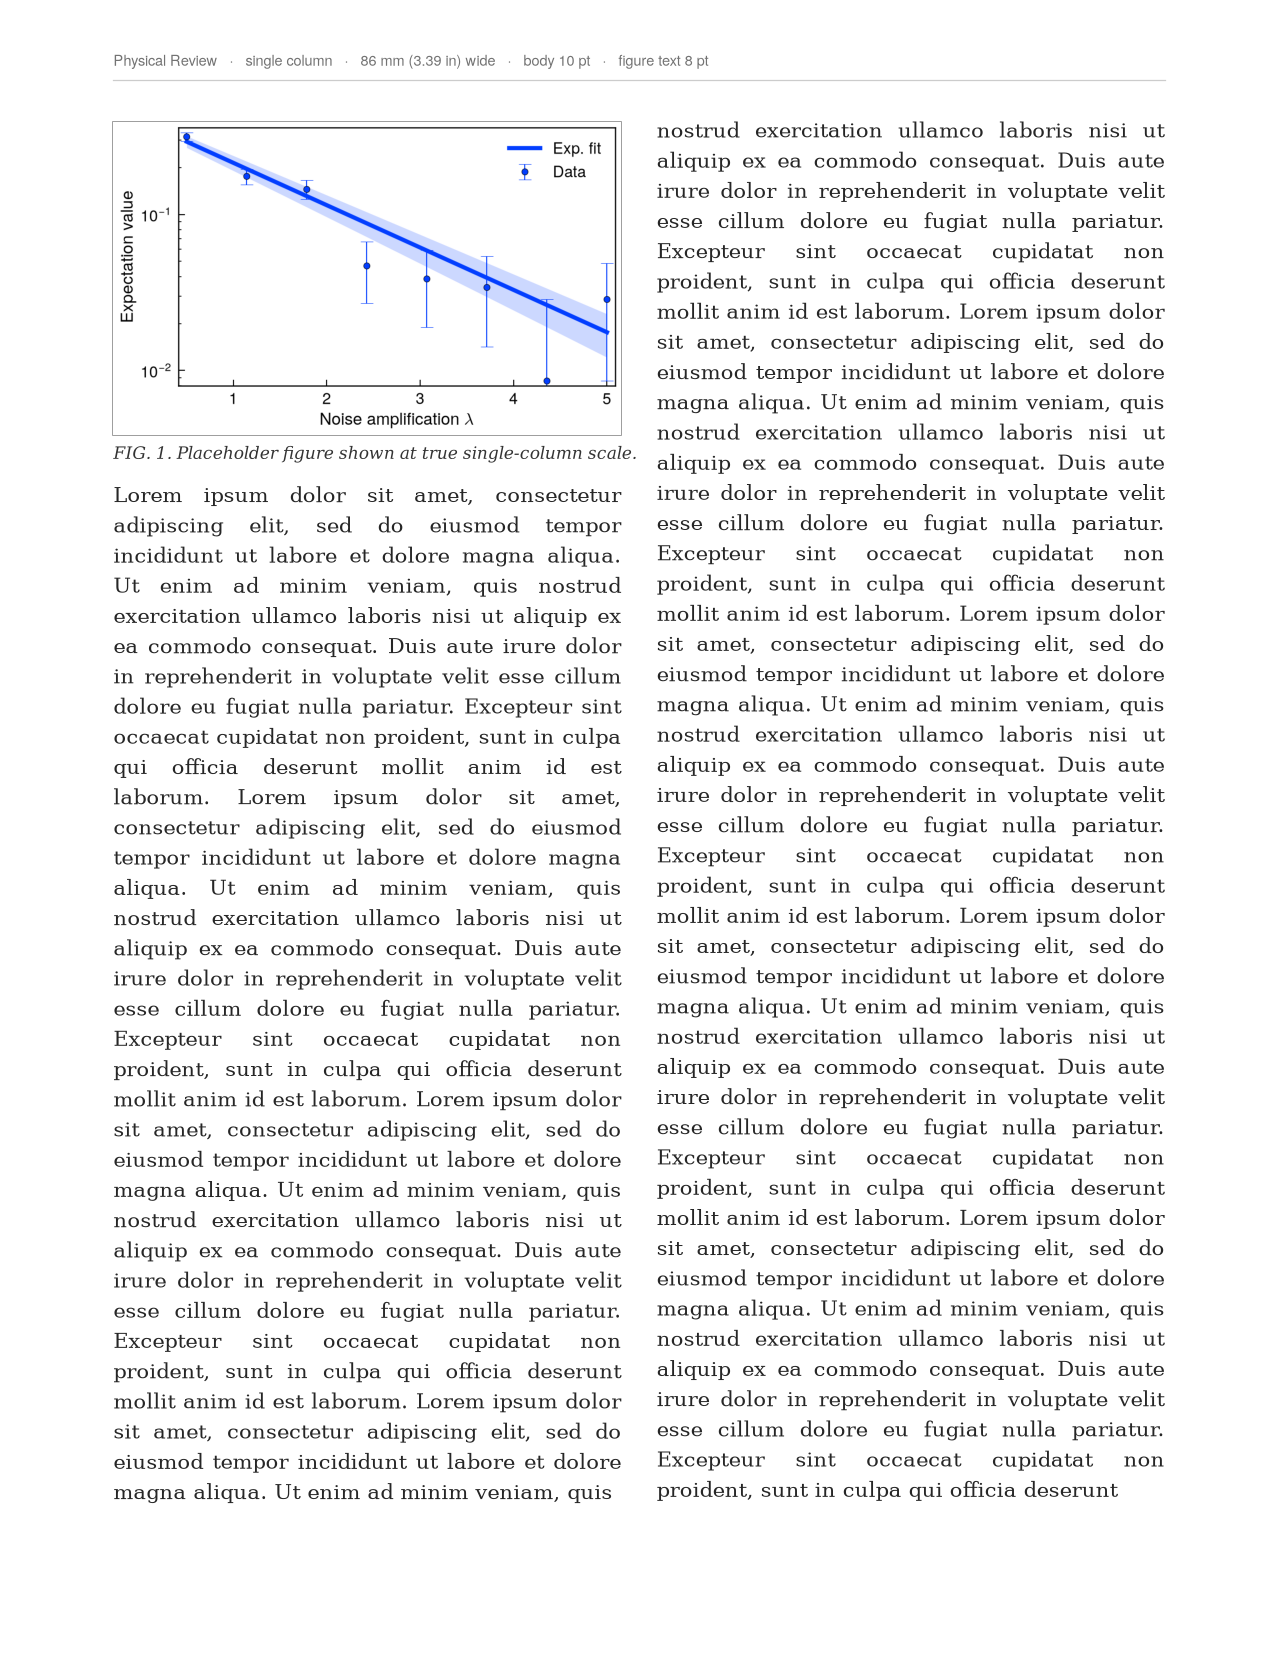
Data + fit + band — in page
-
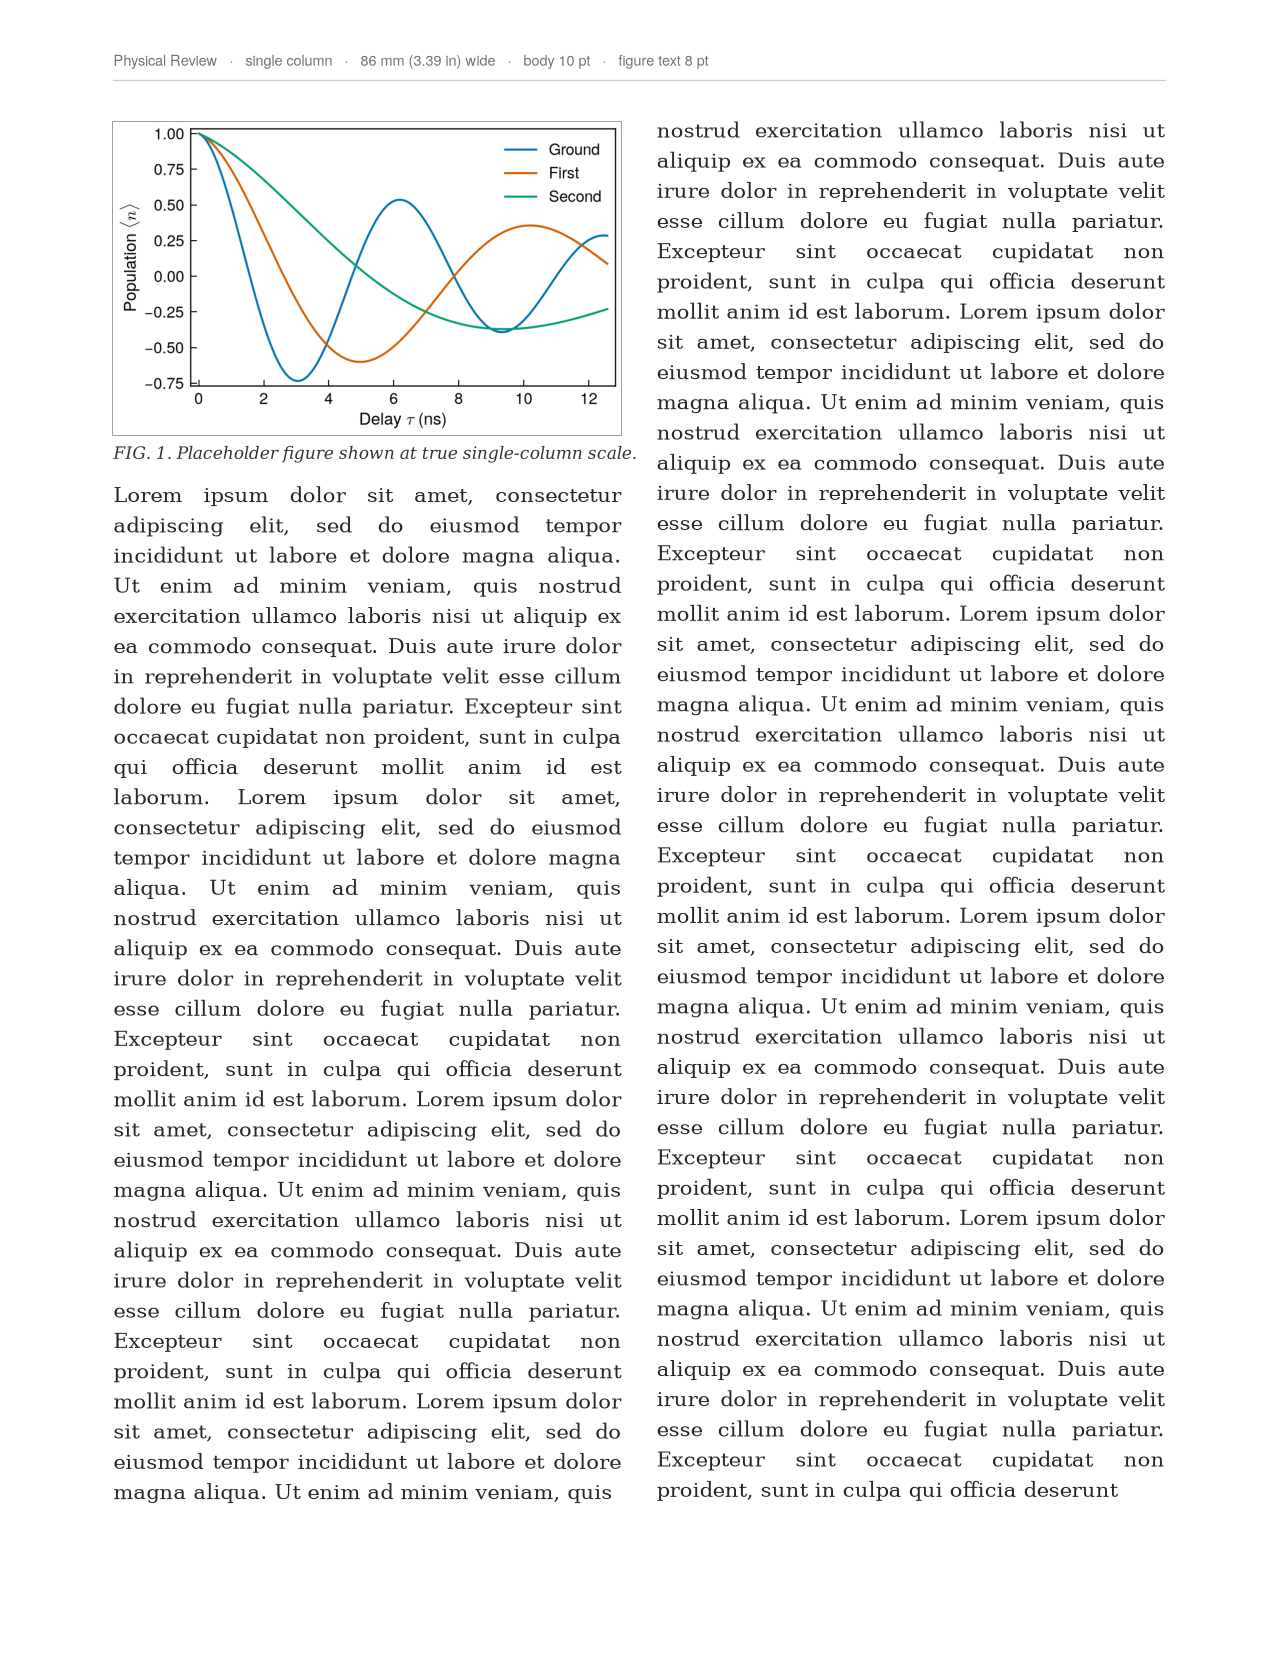
APS single column — in page
-
Double column, across the page
More in the Gallery.
Just want the look?
pp.register_mplstyles() then plt.style.use("paperplot-aps") — no API to learn.
You give up only what a style sheet can't do (true column sizing, font
embedding, preflight); pp.figure()/pp.save() add those back.
FAQ
How does this relate to other matplotlib styling packages (e.g. SciencePlots)?
They're great, and paperplot owes a lot to that lineage — if all you want is a
nicer default look, any of them (or our drop-in style sheets)
will serve you well, and our styles compose just like theirs. paperplot adds the
publishing-specific layer on top: figures sized to each journal's true column width,
fonts embedded as Type-42, and a preflight() linter for the rules journals reject
figures over. Use whichever fits — they coexist happily.
Do I need LaTeX installed? No. The Computer Modern "LaTeX look" is the default
via mathtext, with no LaTeX required. usetex=True is there if you want a real
LaTeX engine.
Created and maintained by Zlatko Minev.